Mass Change in Antarctica: Interview with Frank Pattyn
We caught up for a chat with Frank Pattyn, who heads up the IceCon: Constraining Ice Mass Change in Antarctica project, currently based at Princess Elisabeth Antarctica. IceCon aims to gain a better understanding of the rate of the loss of ice – now and in the past - from the Antarctic ice sheet in the Dronning Maud Land area.
How are things in Antarctica?
Very good, we are preparing to leave for the field, and we have already installed one of our instruments,
The goal of our Antarctic field work is to find out how much the ice sheet contributes to global sea level: whether it is adding mass to the sea, hence raising sea levels, or whether it is gaining in mass, which means it lowers sea level and therefore compensates mass loss from the Greenland ice sheet.
The latest IPCC report, Assessment Report 4 from 2007, stated that most of the Antarctic was growing, in the sense that it was gaining mass because of more accumulation of ice, of snow, and that it was partially compensating mass loss in Greenland.
But we’ve seen over recent decades that there has been large mass loss in Antarctica, especially in the west Antarctic ice sheet, where fast flowing glaciers, such as Pine Island Glacier and Thwaites Glacier accelerate, and loose quite a lot of mass so that they contribute positively to sea level rise.
However, Antarctica is also very huge, and we need to get the complete picture, i.e. how the whole of the Antarctic ice sheet contributes to sea level rise. There are basically three ways to do this.
You can take measurements by doing an input-output calculation where the input is the snow that falls on top of the ice sheet and the output is the mass that it loses through glaciers into the ocean. That’s a very expensive way of doing it because you constantly have to monitor all the gateways from Antarctica. It’s also quite difficult to get a correct answer.
Is it currently impossible?
The input/output method works for glaciers are closely monitored and there is no global view for the whole ice sheet.
A second way of doing it is by satellite altimetry. This is very nice, as it measures elevation changes of the surface of the ice sheet. The only problem is that you need to correct for snow or firn thickness, because the density of the snow influences elevation change. You will have a higher elevation change if your snow is less dense, and a smaller elevation change for the same quantity of snow that falls on it. Therefore you need firn models, which also largely depend on validation. Still, many areas in Antarctica lack sufficient validation.
The signal is always very clear for glaciers that are losing a lot of mass, such as Pine Island Glacier, but much more difficult to recover in areas where change is not so prominent and within the error bounds of the measurement..
The third method is to use satellite gravimetry. There’s one gravimeter on a satellite called GRACE that measures mass changes at the Earth’s surface, which is changes in ice mass, but that is not the whole signal. Other influences in the gravity field are due to isostatic changes of the lithosphere, due to changes in ice mass, and this operates on different time scales.
The earth’s crust moves horizontally, by plate tectonics, but also moves vertically, and some regions move quite rapidly, due to the fact that during the last glacial period, that’s roughly 15,000-20,000 years ago, there were huge ice sheets present. Once they melted, the lithosphere lifted up again.
The Baltic Sea, for instance, is still rising because of the loss of the Scandinavian Ice Sheet, in the order of 1cm per year. But it used to be tens of centimeters per year, at the beginning when the ice was lost. So these are quite important numbers. So, for the GRACE satellite, you need to correct for that. And to do that, you need to know what was the former volume of these ice sheets.
The isostatic models used for this are generally poorly constrained, because you don’t know much the volume that was present, and what’s why we use the word constrain: constraining is what our IceCon project is all about, to check in this particular region of Antarctica, where Princess Elisabeth Antarctica is positioned and there’s nothing much all around - it is pretty void area in terms of scientific knowledge - to find out the mass changes between the last glacial maximum and now, and how they occurred.
This of course will constrain those models to give a better interpretation. As an example, there’s a recent paper by Matt King and co-authors that recently came out in Nature. He worked on a particular area to the west of here, where they also have a number of constraints on the deglaciation showing that the ice sheet was much smaller than those isostatic models predict.
So, what does this mean for the GRACE signal? Well, climate models have shown that over the last ten years, the whole Dronning Maud Land sector here in East Antarctica received much more snow, so there was a mass gain. This mass gain was never retrieved in the GRACE signal. Well, the GRACE signal shows a gain, but most of this mass gain was attributed to the rise of the Earth’s crust because of the unloading of the huge ice sheet that existed during the last glacial maximum.
Of course the situation becomes completely different if you imagine that the ice sheet during the last glacial maximum in this area was not that thick, so the effect of the unloading was much less than those models predict. In that case the GRACE signal will interpret more ice, a change in volume, a positive change in volume, which is then attributed to more snowfall.
So, it’s quite important – we’re talking relatively big numbers, but it is important to get a better grip on sea level rise. There is an important mass loss in parts of the Antarctic, but there are also areas where you have a mass gain. And it’s the moment when you can put a number on the loss and the gain that you have a perfect balance and that you have a better knowledge of what sea level rise is doing at present and in the future.
Is there a danger with current interpretations that you have one dramatic area on the coast of Antarctica, and you see something breaking off and there’s mass loss and that it doesn’t account for the gain overall on the continent, that we focus on the mass loss, and this is misleading?
It can be misleading. If you look at this paper by King, it gives you much smaller numbers for the contribution of Antarctica to sea level rise than some other authors, purely based on a biased GRACE signal. It doesn’t mean that whenever we have a different or better interpretation of what the current mass contribution is to the ocean that the mass loss would not be a dominant factor in the future.
I mean, we see glaciers that are accelerating in West Antarctica, but we don’t see any of this acceleration in East Antarctica yet. And I put “yet” after that, because what we can’t see now is not equivalent of saying this cannot happen in the future. This could happen in the future as well. If that starts to accelerate then we might have a different picture. That’s why we also need better models, on ice dynamics that are capable of looking at that ice loss or gain of the other glaciers especially when ocean currents are shifting, warm water that is situated all around Antarctica, circumpolar deep water that is capable of penetrating up to the continental shelf reaching the grounding line of the Antarctic Ice Sheet. This leads to melting at the grounding line, thinning of the ice shelf and grounding line retreat, hence increased mass loss. That is what happens now in West Antarctica, and around the Antarctic Peninsula, and this something that may in the future also happen to East Antarctica.
But as long as you haven’t observed these phenomena, it’s very difficult to take this into account of course.
So is there also a sense that the increased snowfall in some areas could replace the increased ice loss in other areas in Antarctic, or in Greenland. Is that as simple as it gets, or is there a correlation?
The present contribution is by ice mass to sea level rise is a positive one. It means there’s a dominance of ice loss. Now it’s very logical that we have a mass gain over the central part of East Antarctica, because with the temperature rise, we expect that the atmosphere can take up more humidity and therefore there is more snowfall. That is something that is seen here, and I also measured here, near Princess Elisabeth Antarctica.
So, maybe this is a coincidence because it’s a very small time series, but it is in line with other observations all around here in East Antarctica and Dronning Maud Land. The only thing is, you need to know the amount of it, because if you want to come up with the correct balance.
Mass gain through increased accumulation will not totally compensate the mass loss. We definitely have a mass loss, because if you want to make this sum, so we have currently a sea level rise at rate of a bit over 3mm per year, most of which is due to thermal expansion of the oceans. The second biggest contributor is Arctic glaciers, but of course their relative contribution in the future will diminish.
Arctic glaciers contribution will diminish in the future. The smaller the glacier gets, the less they can contribute to sea level rise, so currently they are the second biggest contributor, but the in future, say in fifty years from now, they will probably be less.
The third biggest contributor is the Greenland Ice Sheet, but then you also have contributions from groundwater depletion, water use, dams, and so on. And while in the AR4 (IPCC Fourth Assessment Report) there was still a discrepancy between the attribution of the different parameters and the observed sea level rise, I think now the research is in such a way that there is no leakage anymore, so we know more or less which of these ice sheets is contributing.
Do these differ widely, are there major differences?
Recent estimates of Antarctica’s present-day rate of ice-mass contribution to changes in sea level range from 31 gigatonnes a year to 246 gigatonnes a year, which is either 0.08 mm/yr or 0.73 mm/yr sea level rise. Not a minor difference.
Are you working with other groups who are contributing to the same body of knowledge?
Yes, of course. This is evidently internationally embedded. For instance, there are a few new SCAR (Scientific Committee on Antarctic Research) programmes coming up. They are two programmes related to mass change. One is the active measurement of mass changes all over Antarctica, and that is based on a network of continuous GPS measurements, which is called CERCE, and based on the POLENET network.
POLENET is a big network of fixed continuous GPS, there are two installed here at Princess Elisabeth Antarctica. This measures horizontal and vertical positions, and gives us an idea of this vertical change due to the uplift. It’s also good to know the gradient in uplift. And therefore you need to put several of these GPS measurements on a line. And that’s why we established one station near the former Japanese Asuka station, 60km from Princess Elisabeth Antarctica, and that will provide us with a first base line. The idea is to put in the future another station within the mountains. We are also setting up a station this year on an ice rise, to try to measure the same thing, but using different methods.
But it will be a bit more complicated, in terms of the interpretation, because the vertical changes which will be measured with the instruments is a combination of factors. And one of these factors is the vertical movement of the ice and so we’re going to measure the vertical movement of the ice and then subtract from the satellite signal and GPS signal and see what we get.
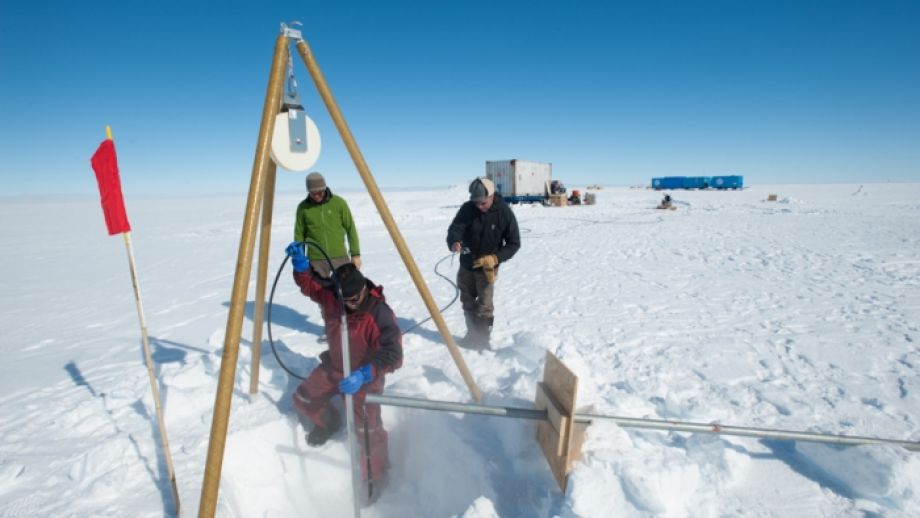
To measure this we need to make density measurements, we measure what we call the strain rates, the rate of deformation in the vertical, at different depths, using a method the “the coffee can method”. This has nothing to do with coffee – the first time scientists did it, they needed something, and what they had was a coffee can, and that’s what they used.
You make a borehole, and you drop, well, a coffee can, or a heavy metal object on a string, to the bottom of the borehole and let it freeze in. Then you attach a cable at the surface, and you measure, you know the surface will lower because of the changes in density and the weight, but the point below will lower less so it means your cable becomes shorter, so you get a longer end at the exit. So what you measure each year is the change. Then you have the change of what your surface is doing and what is happening at depth, in terms of movement.
We will make several holes at different depths, in order to have a profile of how the deformation, the lowering at depth occurs. To make it work well, you have to do it in a zone where you don’t have horizontal motion, and that’s why we go on an ice rise, like the Derwael Ice Rise. We are taking the measurements on the highest point of the rise.
We’re not only working on IceCon, this is also the Be:Wise project, we’re sharing logistics here at the coast, and the Derwael Ice Rise, where most of the measurements are being done. We’re making an ice core drilling, boreholes made with the hot water drill, for the coffee can method, and a continuous GPS installed. The continuous GPS will measure for several years; it’s completely standalone, works with solar panels and wind turbines to get power.
How many GPS are you positioning for IceCon?
We are leaving two GPS, one installed on rock near the former Asuka Station, and one on the Derwael Ice Rise
So what people are saying is that in the past we said it was going to rise so much, now there’s been an increase of this much, therefore an increase sea level rise?
We now have better ways of predicting, we don’t have the same tools, we better understand the processes, we have better constraints, on a lot of things, now we know we can close the budget, the sea level budget wasn’t closed in 2007. There was something that was missing – quite a lot, in fact.
We now have the whole budget; we know that the observed sea level rise can now be affected by several factors, thermal expansion, glaciers, ice sheets, groundwater and so on. And now if you add them all together you get to a number that is within error bounds close to the currently observed number.
Picture: The IceCon team "hot-drilling" into the Derwael Ice Rise in Antarctica, as part of the "coffee can" method to work out movement of the ice sheet. - © International Polar Foundation